Prevent Xamarin Forms SignaturePad memory leak on Android
Last year at a local conference I gave a talk on topic “Xamarin Forms Application Performance Through Memory Management”. One of the examples I presented was occurrence of memory leak when using Acr SignaturePad control, which caused Out of Memory exception on Android after 10-15 signings. In the meantime the control became obsolete as Xamarin introduced the new version of their SignaturePad control which now supports Xamarin.Forms. Unfortunately memory leak is still an open issue on GitHub that bothers many developers.
The issue is deeply rooted in the way how Xamarin framework handles memory management. I highly recommend you to get familiar with all the aspects of Xamarin Garbage Collection, but I will outline the key points here as well.
Garbage collection
Garbage collector has 3 functions:
- Gives memory for your objects
- Computes which objects are reachable
- Gets rid of the rest (garbage)
Xamarin.Android uses mark-and-sweep garbage collector with two generations and a large object space, with two kinds of collections:
- Minor collections – collects young small objects (Gen0)
- Major collections – collects mature small objects (Gen1) and large object space heaps
Generational hypothesis is that majority of the objects are small and die young. That’s why all of the objects smaller than 8 KB are created in minor heap. When that heap becomes full (no more memory for new allocations), a minor collection is being invoked. All unreferenced objects from the minor heap are being collected, while the referenced ones (still alive) are being moved to the major heap.
It is very important to understand that without your intervention GC will run only when the minor heap has run out of memory for new allocations.
Xamarin.Android Memory Heaps
There are three types of objects:
- Managed objects: Live only within Mono/.NET heap, for example your business logic variables. They do not inherit from Java.Lang.Object and they are collected normally by the Mono GC.
- Java objects: Java types which are present within the Android runtime VM, but not exposed to the Mono VM. These are collected normally by the Android runtime VM.
- Peer objects: Instances of these types have two “halfs” a managed peer and a native peer. The managed peer is an instance of the C# class. The native peer is an instance of a Java class within the Android runtime VM, and the C# IJavaObject.Handle property contains a JNI global reference to the native peer.
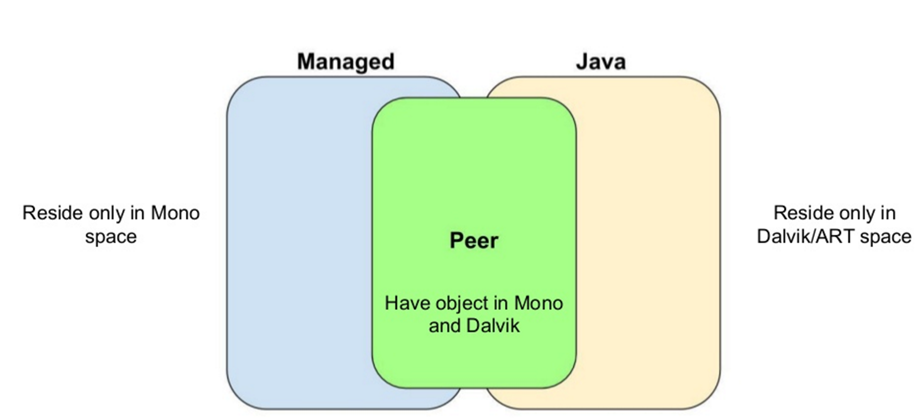
Android runtime collections could be invoked by the Mono GC or they could be run by Android at any time. That’s why JNI global reference is treated as a GC root, preventing the object in Android world to be collected as long as there is a reference from Mono world.
SignaturePad case
All this brings us to the issue with SignaturePad. Here we have an example of peer objects. Every time user signs, objects on both heaps are being created:
- 20 B pointer on Mono minor heap
- 12 MB Bitmap image on Android heap
Now imagine repeating it 10 times. Newly created Mono heap objects occupy almost no space, while at the same time they reference to 120 MB on the Android heap. In the meantime the Android GC may run, but it cannot dispose the images as references from Mono are still alive. The Mono GC will not run until the minor heap is full. Depending on the size of the minor heap and memory consumption of the app, that could take a while. SignaturePad does not dispose references and waits for new Mono GC cycle, which exposes your app to Out of Memory exception.
Demo
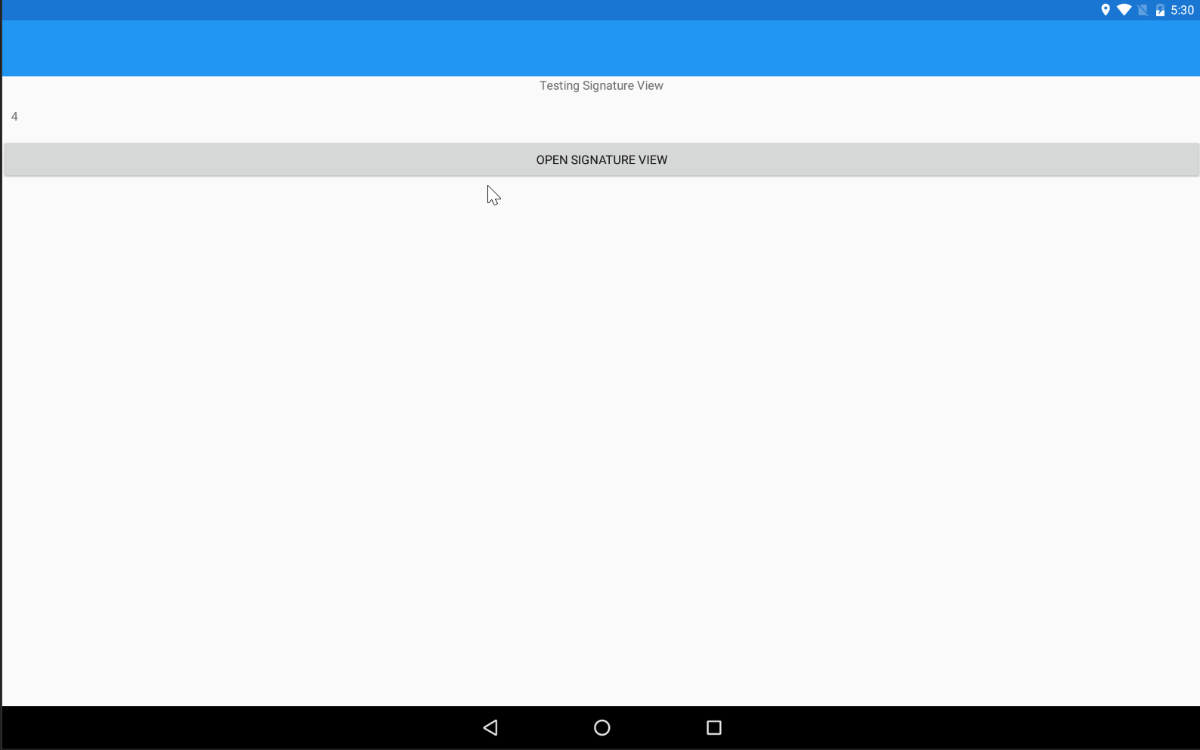
I will demonstrate this on TestSignaturePad solution posted on the GitHub issue. For easier sharing I uploaded the code to my GitHub repo.
I am using VS2017 and Visual Studio Emulator for Android. Very useful tool in this case is Android Device Monitor. You can open it directly from Visual Studio toolbar:

On the left you will be able to see the list of processes running on your device/emulator. Choose TestSignaturePad.Android and click on green”Update Heap” icon. This will give you detailed info on Android heap space allocated for this process. Data is updated on every Android garbage collection, which you could invoke by using “Cause GC” button.
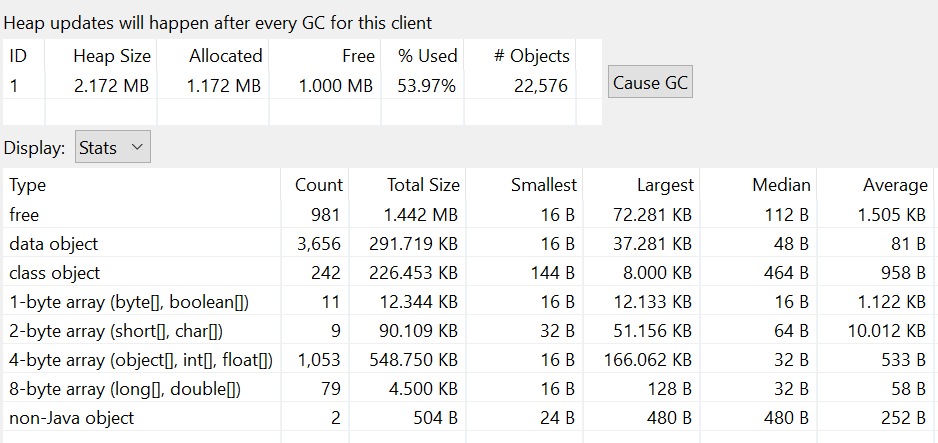
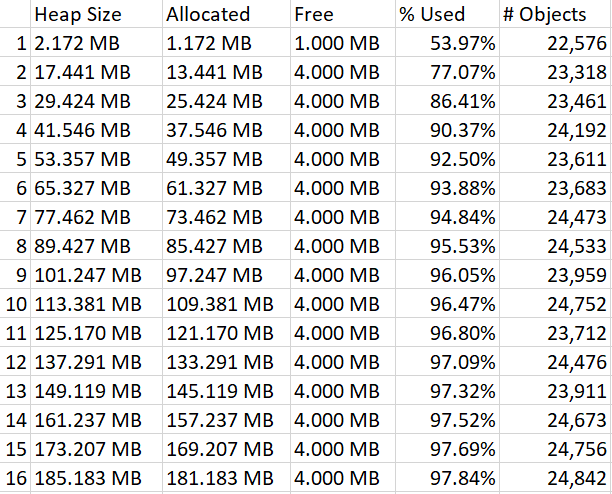
We will focus on heap size. At initial state the application occupies 2 MB. After the first signing it will grow to 17 MB. Each following signature will add additional 12 MB.
Let’s repeat the process until we hit Out of Memory exception:
E/mono-rt ( 9463): [ERROR] FATAL UNHANDLED EXCEPTION: Java.Lang.OutOfMemoryError: Failed to allocate a 12544012 byte allocation with 4183136 free bytes and 10MB until OOM
E/mono-rt ( 9463): --- End of managed Java.Lang.OutOfMemoryError stack trace ---
E/mono-rt ( 9463): java.lang.OutOfMemoryError: Failed to allocate a 12544012 byte allocation with 4183136 free bytes and 10MB until OOM
E/mono-rt ( 9463): at dalvik.system.VMRuntime.newNonMovableArray(Native Method)
E/mono-rt ( 9463): at android.graphics.Bitmap.nativeCreate(Native Method)
E/mono-rt ( 9463): at android.graphics.Bitmap.createBitmap(Bitmap.java:831)
In my case it took 16 signings to break the app. The number may be different on other devices. To isolate the main contributor to the memory consumption, I tried caching SignaturePage instance instead of creating a new one for each signing. The result was exactly the same.
Solution
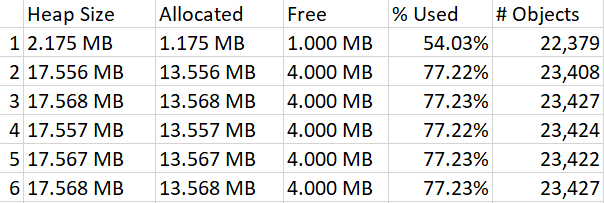
The solution/workaround is to add an explicit Mono GC call. For demo purposes I added GC.Collect() in SignaturePage.Button_OnClicked method after Navigation.PopAsync() is executed. You could put GC.Collect() somewhere in your ViewModel after a signature is obtained.
After the first signature memory goes to 17 MB. The next signature adds 12 MB, but as soon as it does GC.Collect() is being invoked. What it does is removing reference to bitmap image from Mono heap and then invokes Android GC, which removes the image as well. The result is Heap Size being 17 MB after each cycle.
Here we can see Mono GC log:
Explicit concurrent mark sweep GC freed 388(17KB) AllocSpace objects, 1(11MB) LOS objects, 22% free, 13MB/17MB, paused 60us total 3.732ms
D/Mono (14060): GC_TAR_BRIDGE bridges 70 objects 146 opaque 10 colors 70 colors-bridged 70 colors-visible 70 xref 6 cache-hit 0 cache-semihit 0 cache-miss 0 setup 0.05ms tarjan 0.04ms scc-setup 0.01ms gather-xref 0.00ms xref-setup 0.14ms cleanup 0.01ms
D/Mono (14060): GC_BRIDGE: Complete, was running for 119.72ms
D/Mono (14060): GC_MAJOR: (user request) time 1.67ms, stw 2.86ms los size: 1024K in use: 72K
D/Mono (14060): GC_MAJOR_SWEEP: major size: 1312K in use: 442K
Every garbage collection (explicit or not) has performance implications, because it blocks all the threads until finished. Usually this is an insignificant performance hit, but depending of you performance goals it may or may not be acceptable. Until Xamarin team implements proper reference disposing for SignaturePad, you may have to stick with explicit GC.Collect().